The Resume Plot
Zauad Shahreer Abeer / 2020-09-26
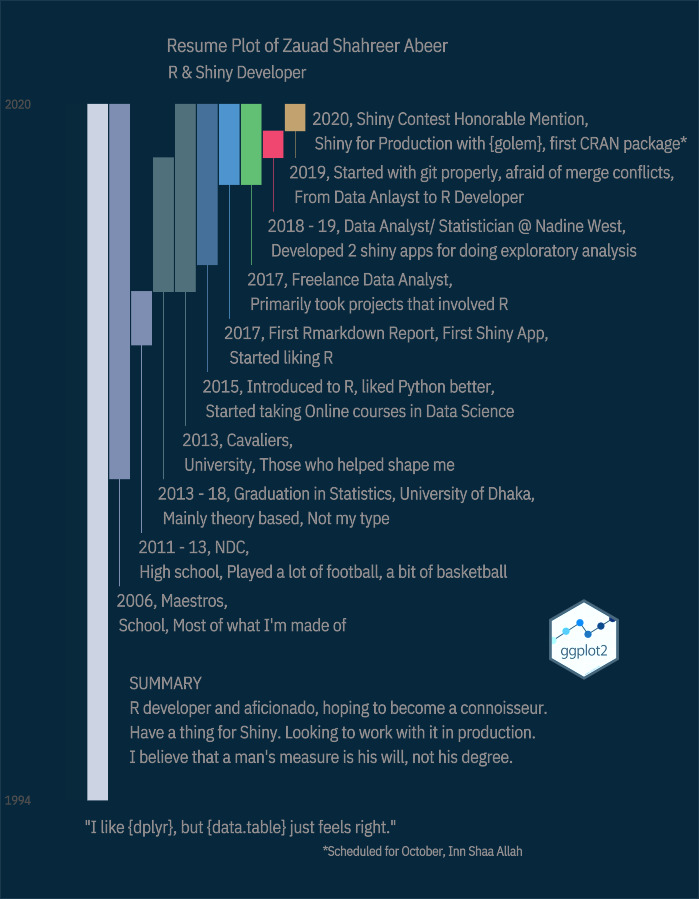
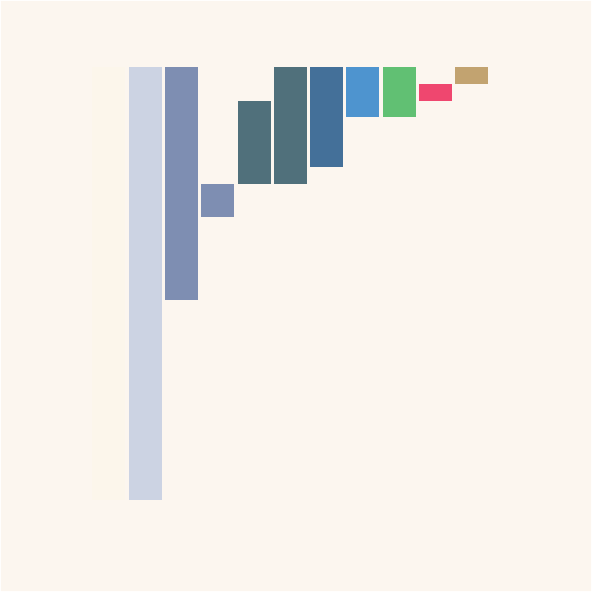
Fig: The resume plot
This plot is called The Resume Plot.
It is inspired by “The timeline of thanks” plot from the
awesome book Storytelling with data.
It’s a ggplot, bars are created from a hand-made data.frame.
The texts & the lines are made using annotation.
The hex-logo is added using magick::image_composite()
The github repo has the codes that made the plot.